
Compiled and written by Brian Hollingshead
FAC Chairs
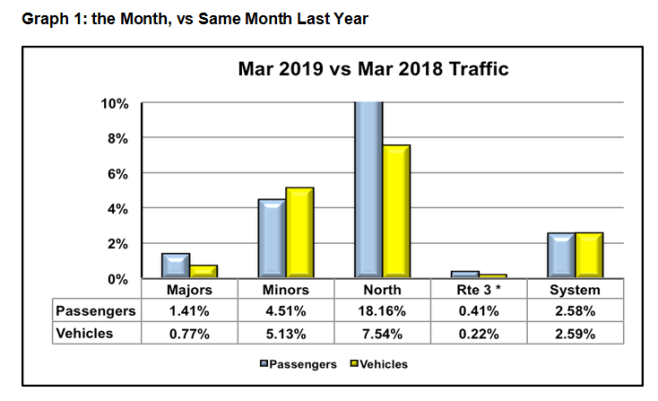
’Twas a very good month (at least for the Minors and the Northern Routes). March_2019_Traffic_Stats For the Majors, only slightly better than their anaemic year to date performance. The Minors realized growth on all routes, with several in excess of 6%. Overall, the Minors vehicles were up 5.13% and passengers up 4.51%. Graph 1. The Majors, vehicles up 1.41%, passengers up 0.77%. Both groups managed to exceed their year to date growth rates. Bottom line, System traffic was up over last March by 2.59% and 2.58%, vehicles and passengers respectively.
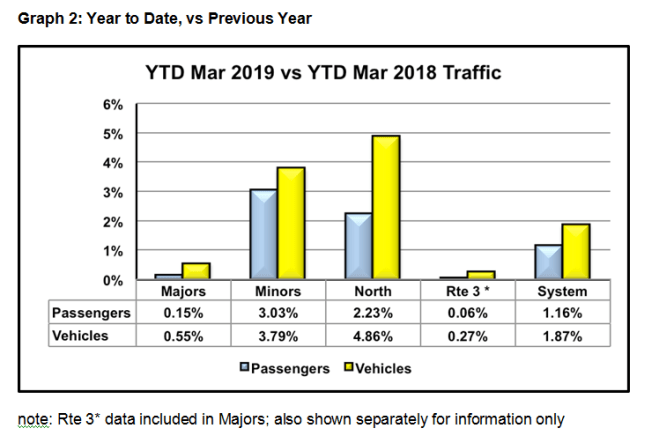
March is the last month where fears of traffic collapse and/or hopes for miraculous recovery screech to a halt. The fiscal year is over and done. System vehicle traffic, fuelled by the Minors, increased 1.87% and passengers, 1.16% over FY2018. Graph 2. This is slightly less than the 2.6% and 1.6% anticipated by BCF, but not that far off, considering how early that forecast was created and built into the PT5 application. The miserable February weather was an unexpected drag on the average.
Looking at March traffic over the past nine years, including the various bits of Easter weekends and Spring breaks that occurred through the period (Graph 3), the upward trend since the depths of 2014 continues, if slightly slowed. Given the variables in March weather and out-of-school times, the trend is solid. Minor fluctuations in the rate of growth from year to year are not a concern.

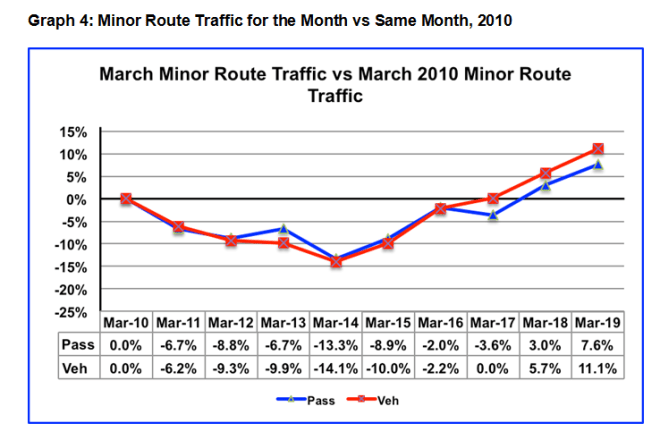
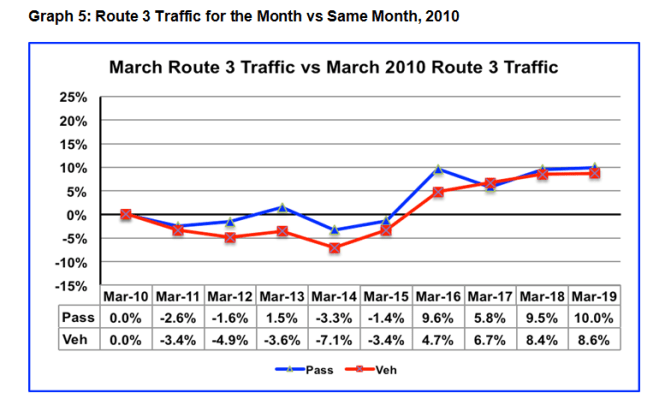
The Minor Route March history (Graph 4) is similar to the System picture, except the March 2014 ditch was deeper and the recovery stronger. As has been the case all year, the Minor Routes were the traffic growth leaders, likely due in large part to the 15% fare cut and restoration of free BC seniors’ Mon to Thurs travel. Major routes, including Route 3 (Graph 5), much less robust traffic increase.
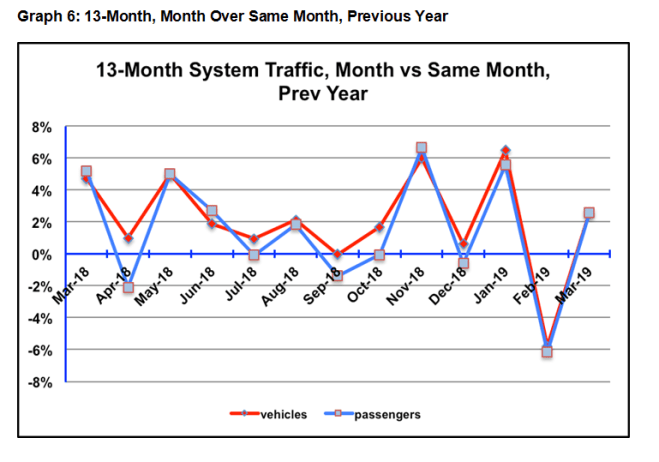
Graph 6 frames the fiscal year. Traffic dropped off from the high expectations created last year, beginning in May and continuing through the smoky summer, the money making season. Couple of shoot-out-the-lights months, Nov and Jan, but unfortunately happening when traffic is at its lowest. And then February the Horrible. An OK year, if a little disappointing stacked against the previous three years.
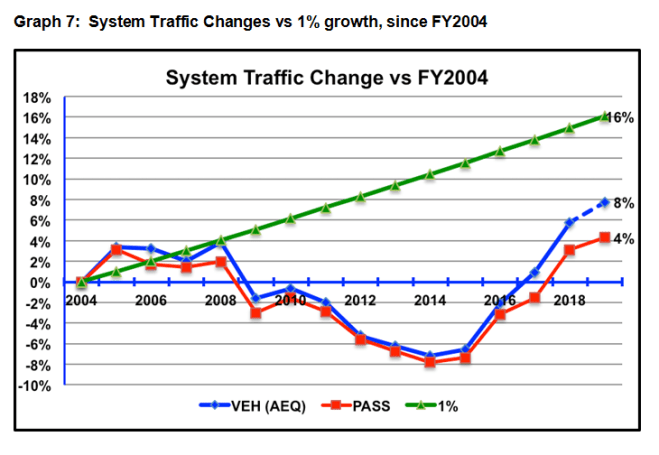
Graph 7 illustrates the overall years’ traffic changes compared to FY2004, the year of the shift to the current model. The final numbers, 8% and 4% relative growth, are down slightly from the 9% and 5% projected with the BCF forecast. Close enough for forecasting. Passenger growth is a final now. The vehicle growth is an estimated AEQ growth, based on actual year to date traffic count. Final AEQ count will be available in July. Still well under the modest 1% growth that was throttled for the first 10 years. But heading slowly toward recovery. Lot of ideological throttling going on in those early years.
And finally, the long look, (Graph 8) where we see vehicle traffic greater than it’s ever been, and passenger traffic approaching that point. Anybody tells you traffic is big picture cyclical, don’t you be believing them. It isn’t. It grows with population and the financial well-being of the area. It collapses when ideologues take a wrecking ball to fares and/or service. It recovers when someone eventually takes away the wrecking ball.

Perspectives on the ‘bare numbers’ . . .
– For BCF, booming traffic means booming revenue, perhaps more money to invest in new ferries, terminal facilities, IT systems and other bits. Also, more stress on the system.
– For the customers, improved traffic reflects and supports healthier communities. Beyond a certain point, it means more and longer sailing waits, and it becomes a choke on tourism and local businesses. BCF and gov’t attention is required to plan, to the extent possible, sufficient capacity and flexibility to reasonably meet the demand. There are wrinkles but it’s not rocket science.
– For the gov’t, it means healthier communities and happier voters, provided there is sufficient ongoing funding to support fares seen to be ‘affordable’ and fare increases seen to be ‘fair’, along with sufficient investment to support right-sizing the fleet as needed. The Macatee Report and most recently, the Redlin Report have been instrumental in bringing some much needed customer focused sanity to the Draconian thinking that came with the original restructuring in 2004.
It’s vital this customer- and community-focused orientation not be taken for granted. The Hungry Dollar never sleeps. Whatever the new Super Advisory crew turns out to be, the Ferry Advisory Committees are and will remain the groups closest to the coastal communities. The ferry service is their lifeline. And you are their voice.
The future? I’ll leave that to others who will be around to answer for their unfulfilled shots in the dark.
This is my last traffic report. This gig has been blast, and now it’s on to other things. Give your support to Diana and Keith when they ask for it; they can’t do the job in a vacuum.
Comment, questions, suggestions? Too late. Save them for the next gen.
Cheers,
Brian
