
Written by Brian Hollingshead
FAC Chairs
‘Brutal’ probably best describes February ferry traffic. Vehicle traffic down 5.78%, passenger traffic down 6.16%, compared to Feb 2018. February_2019_Traffic_Stats Substantial traffic losses on almost every route. Graph 1. The Northern routes, apparently bucking the trend, only did so as a result of gains on Rte 11 offsetting the losses on Rte 10. As shyly predicted last month the ‘brutal’ (for coastal BC) weather was almost totally to blame for the traffic hit.

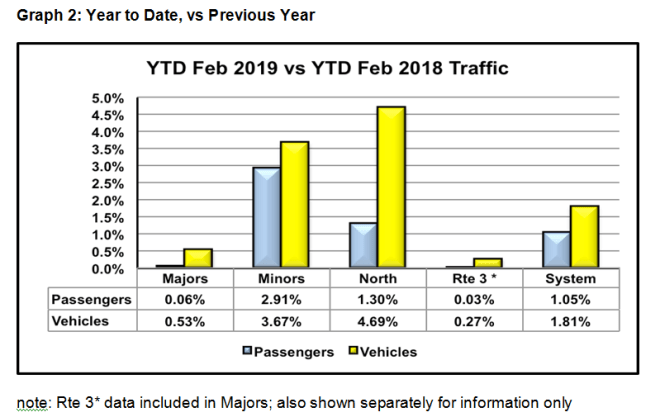
Graph 2 reassures us there will still be a modest traffic increase when the year closes in another month. However the Feb losses have dialled back the anticipated gains by about half a percent from last month’s look.
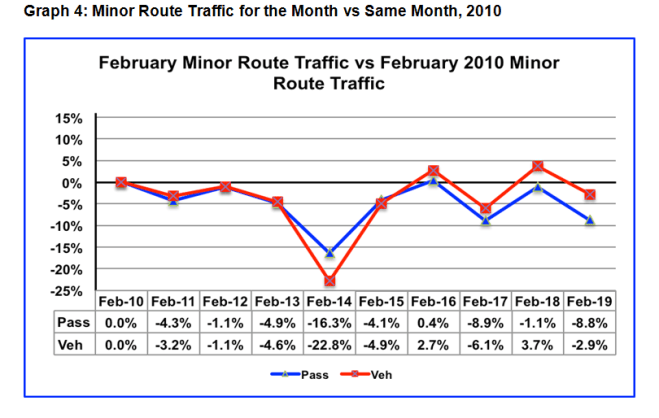
Graphs 3, 4 and 5 compare Feb traffic for Februarys back to 2010, when we first started receiving this data. No surprise, this Feb is substantially lower than last Feb. The large gap between vehicle and passenger traffic for the system and for Rte 3, as explained last year, is due to the 2010 Winter Olympics. That was the year the whole province was invited to come to the Lower Mainland to join in the fun, BUT do not even think about bringing your car into Nightmare Alley Vancouver traffic. So vehicle traffic dropped substantially on the Majors, including Rte 3, while passenger traffic exploded. And that abnormal traffic became the base for succeeding Februarys. Aside from being the first year the data was available, there’s nothing sacred about 2010. If 2011 or some later year is used as the base year in future, the vehicle and passenger traffic will track more closely. The Minor routes were only minimally affected by the Olympic drama and thus, their passenger and vehicle traffic tracked quite closely.


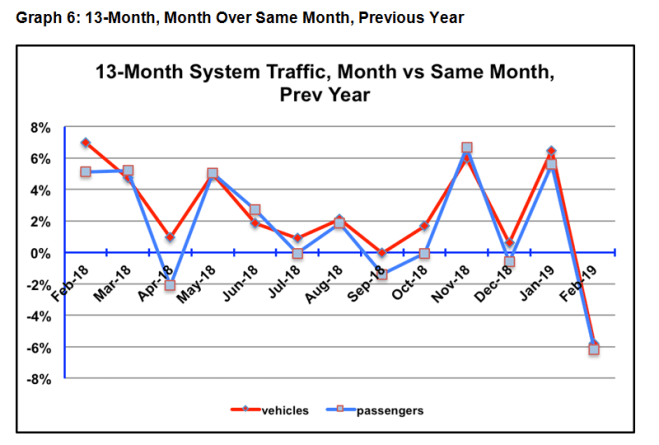
It’s been a depressing traffic (and revenue) year, compared to the heady experience of the previous fiscal year. Graph 6. Three good months. Six middling months and then, ouch!, this February. Not to dwell on the subject, but March doesn’t hold out a lot of hope for improvement, in that it will lack half an Easter weekend it enjoyed last year. Happily, the weather seems to have now turned the corner, two thirds of the way through the month.
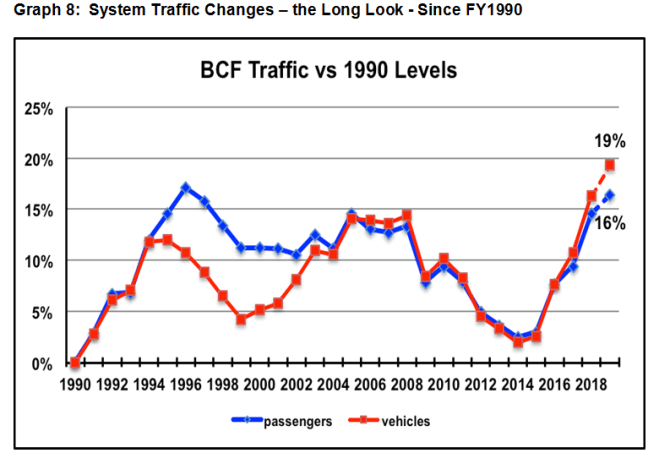
Graphs 7 and 8 provide long and longer term looks at traffic, with the years of famine followed by the past four years of plenty. The roughed in numbers for fiscal year 2019 are as presented in the BCF submission for PT5 fare increase caps, last September. As a result of an excess of unkind winter weather, it’s likely those numbers are going to prove to be a bit optimistic. We’ll know better in a month.

Questions or comments, feel free. Sort of.
Brian
