Click on an image to see a larger version, or download a pdf version where available.
Raw data is from BC Ferries unless otherwise indicated.
|
Latest trends in ferry traffic |
Fiscal 2015 compared to Fiscal 2014.
|
|
Who pays for coastal ferry services? |
BC Ferries cumulative revenues since the start of the new ferry structure in 2003. Ferry users: $5.49 billion since 2003 (78%) Provincial goverment to BC Ferries: $1.25 billion since 2003 (18%) Federal government: $0.29 billion since 2003 (4%) Provincial government support to social program beneficiaries: $0.23 billion since 2003 |
|
Government funding, then and now |
Sources: BC Ferries, BC Ferry Commission, Ministry of Transportation
|
|
Fare Increases
|
Passenger fare increases since 2003
|
|
Lower fares boost traffic |
Over-height fare premium removed in FY2011, resulting in 40% fare reductions for over-height vehicles and resultant traffic growth. Traffic will respond at the right price point. |
|
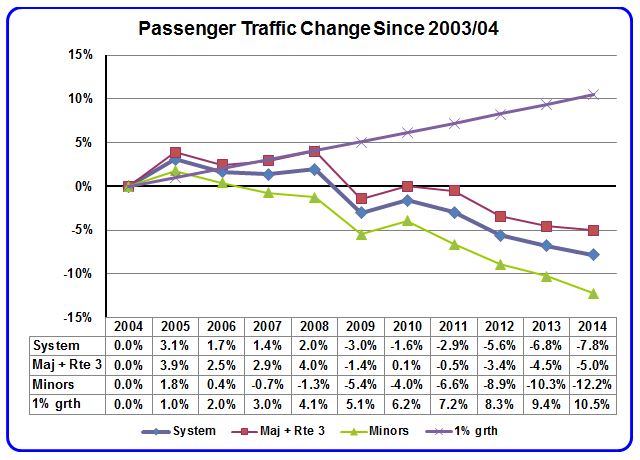
System traffic changes since 2003 |
Note the comparison to what a modest 1% traffic increase would have been. Vehicle traffic suffered similar declines. Northern routes experienced a 31% decline. |
|
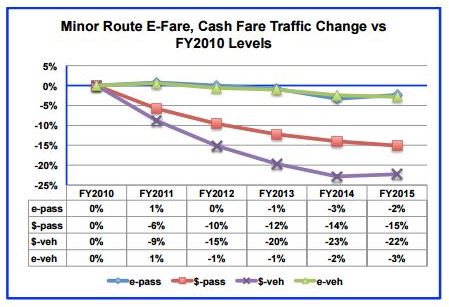
Discretionary and non-discretionary traffic trends |
Minor route traffic trends comparing e-fare and cash-fare traffic |
|
Minor route traffic trends |
Minor route traffic volume reductions since 2004
|