
Compiled by Diana Mumford with coaching from Brian Hollingshead
Hi Everyone:
Brian has passed on his task of preparing the monthly ferry traffic stats to me. Luckily he is a very patient man who has provided me with lots of instructions and one-on-one lessons. Please blame errors on the ‘student’ and not the instructor! The commentary he usually provided will be much more brief and general as I still need practice in telling the tales of ferry life! Please also remember that I will be seeing all of this through a different lens as my ferry travel route is different than Brian’s.
The reason for the long gap between March and May stats is that BC Ferries did not release the April traffic information until they released the May info. April_2019_Traffic_StatsMay_2019_Traffic_Stats
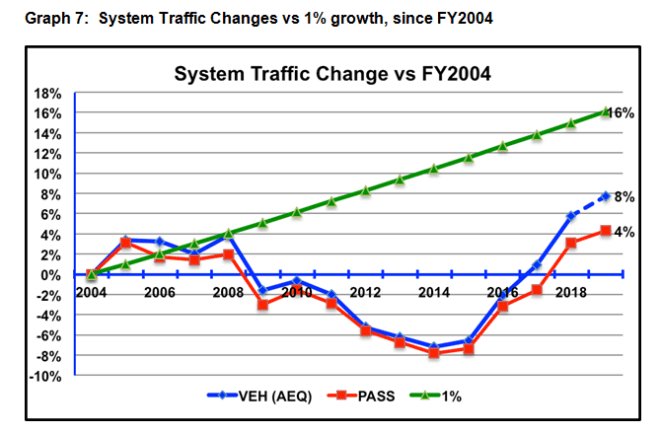
As such the May YTD graphs are shown below.
As you can see from the graphs the traffic levels continue to increase for the Northern and Minor routes, while the Majors and route 3 go the other direction. Some of that decrease in majors and route 3 could be the split in holidays for spring break and Easter, but I would also guess that the move to the shoulder schedules is a contributing factor. The ferry service provided is causing significant overloads with residents and travellers left waiting on the ferry parking lot hot tarmac for hours.


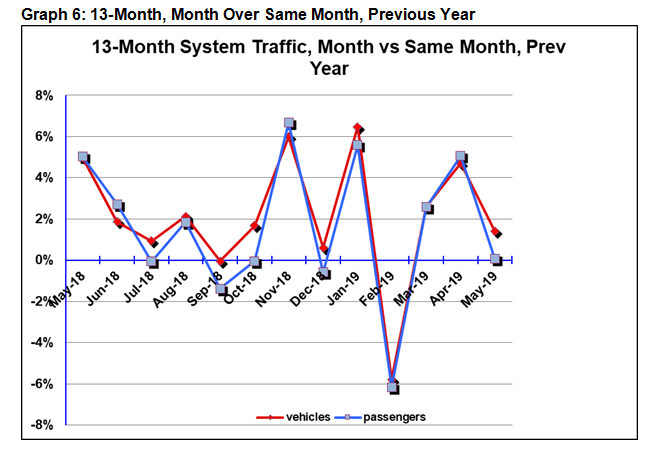
The overall increase in ferry traffic through the system in comparison to last May is 0.07% for passengers and 1.41% for vehicles. This number would be very different if the 20+% increase for the two routes of 9 (Southern Gulf Islands) and 10 (Port Hardy to Prince Rupert Inside Passage) were not included.

Please let me know if this information is beneficial and if anything is missing for you.
Happy Long Weekend!!
Diana Mumford Co-Chair
Ferry Advisory Committee Chairs
