
Hi all,
A traffic-sucking, slurpy September. That record rainfall, hard to forget. September_2018_Traffic_Stats
A reminder that weather can upset the trend in any given month. Summer smoke – we can call that weather – and September rains derailed the hitherto upward traffic trend. Check out graph 1. System vehicle traffic down 0.05% (effectively flat) and passenger traffic down 1.39%. The Majors lost both passenger and vehicle traffic. The Minors, a little better, but not much, with vehicle traffic up half a percent. Rte 3, an almost carbon copy of the Minors. While the North appeared to be bucking the trend, the increase there was almost totally the result of the new traffic on Rte 28.

The year-to-date picture, graph 2, is some healthier, based on the April to June increases. The Minors were the beacon of hope, while the Majors struggled. The assumption here is that the 15% fare cuts on the Minors provided a boost, one that was missing on the Majors with no fare cuts. Not surprising.

Peeling the weather onion, the Big 3 Majors all lost both vehicle and passenger traffic. They also carry a heavier percentage of discretionary traffic than the Minors. Discretion may be the better part of valour. It also seems to be the better part of taking a fun ride on a ferry in the rain.
The Minors’ anaemic performance on the other hand does not reflect individual route results. Those were all over the map, from up 5% on some routes to down 5% on others. It just happened the ups and the downs balanced each other. Explanation for these results can only lie with the individual routes. There’s not a common explanation that fits them all.
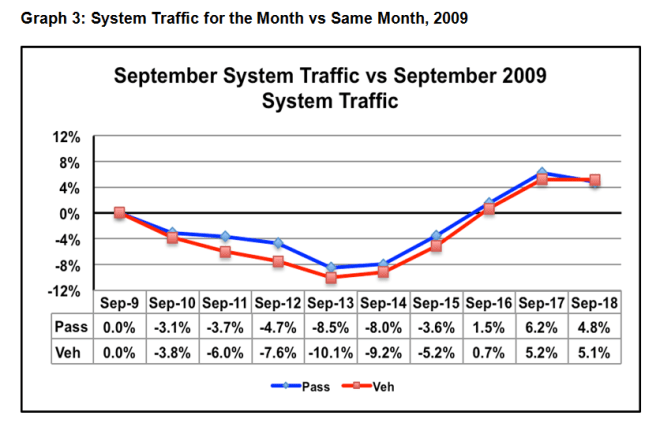
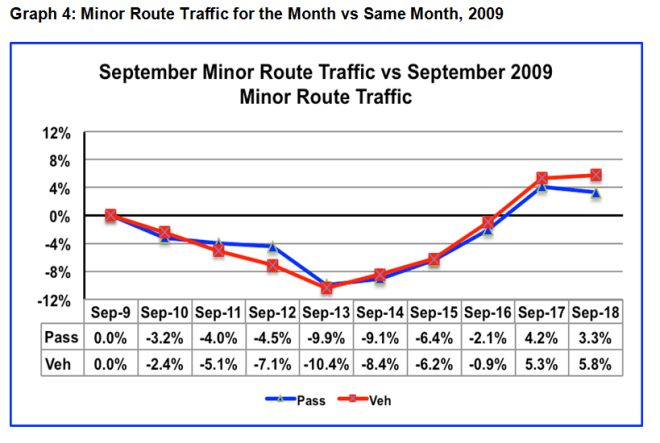
Graphs 3 and 4 illustrate how this September fits with previous Septembers back to 2009, for both the System and the Minors. Four years of steady growth, and then ‘blah’ for this September. While disappointing to see that growth pause, we need to keep in mind that the increased traffic level attained over those past four years as been sustained, more or less, this past month, Still a lot more wheels on the deck and bums on the seats than four years ago. And overloads.
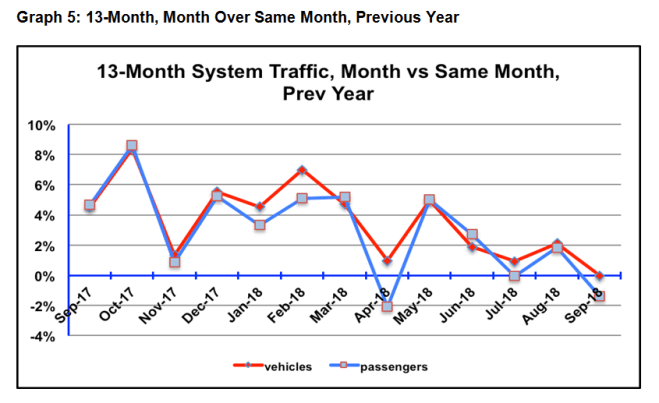
The 13 month look (graph 5) is interesting, in that the heady gains of a year ago started cratering in June and have effectively ceased to exist since then. The drop in April was due mostly to the loss of the front end of the Easter weekend this year (vs the full Easter weekend last year). As noted earlier, this summer (June through September) has been one of ferry-unfriendly weather. The October results should be better, with the caveat that traffic last October was exceptional (8% above that of the previous year). It will be a challenge to improve upon that.
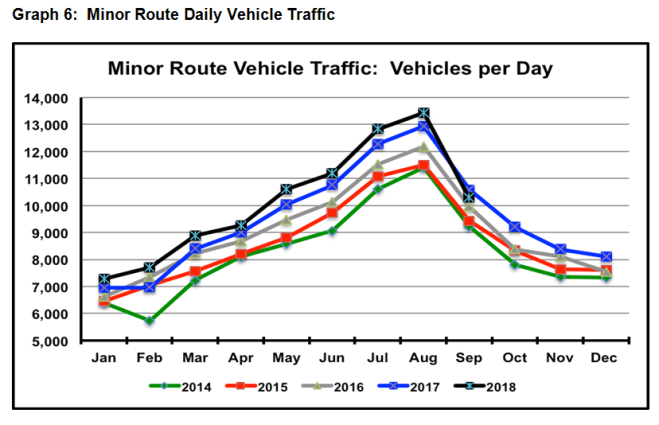
Graph 6, the daily traffic tracker presents the first bleep in our text book picture of steadily growing Minor route traffic. The bleep notwithstanding, the picture has been and remains one of consistently increasing traffic volume on our routes. One sucky month doesn’t alter that.
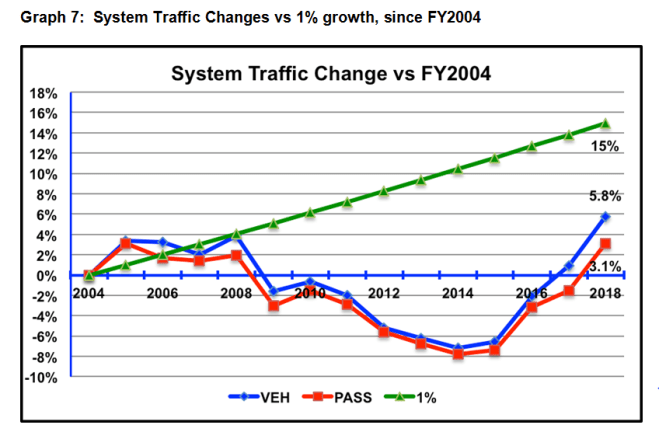
The Big Picture, illustrated in graphs 7 and 8, will continue to reflect traffic growth, just not as dramatically as for the past three years. That said, BC’s coastal population is still climbing every day and the healthy economic climate suggests continuing GDP growth. Both are primary determinants of ferry service demand. Barring any unforeseen cataclysmic events, it seems reasonable to expect continued ferry traffic growth. Fleet capacity increases with the new boars will help.

So, what to expect . . .
Last month, we forecast year end system traffic growth of 2% for vehicles and 1.5% for passengers. BCF, in their PT5 submission, went out on the limb above us, contemplating 2.6% vehicle growth and 1.6% passenger growth. At this time, I suggest both are optimistic, though ours less so. Interesting that the submission anticipates no growth or decline through PT5.
Overall, coastal ferry traffic has come a long way in the past four years, though hitting a bit of a rocky patch this past four months. That said, the fundamentals remain in place, and there’s no indication of resumption of punishing fare hikes. Once capacity more or less catches up with demand, the future looks promising, both for traffic levels and for the economic and social well-being of our communities, so dependent on this life-sustaining service. There seems to be a harmony of vision shared by BCF, the Province and the coastal communities, one that’s most welcome.
Enough!
Feedback always welcome.
Brian
