
FACChairs,
BC Ferries Traffic Stats Download June_2018_Traffic_Stats
A bit of a departure from our dead boring, everything’s lovely comments of the past months. Traffic is still up, 2.7%, passengers and 1.9%, vehicles (graph 1). Dampened somewhat by a few head-scratchers this month.

For instance . . .
– traffic, particularly vehicle traffic, substantially off on Routes 2 and 3, dragging down the Majors. This is consistent through the four months of this fiscal year (graph 2). Horseshoe Bay congestion a factor? That can and will discourage discretionary traffic. Coastal Inspiration being out of service? Probably another factor. Rte 30 is likely picking up some of lost Rte 2 traffic, but certainly not all of it.
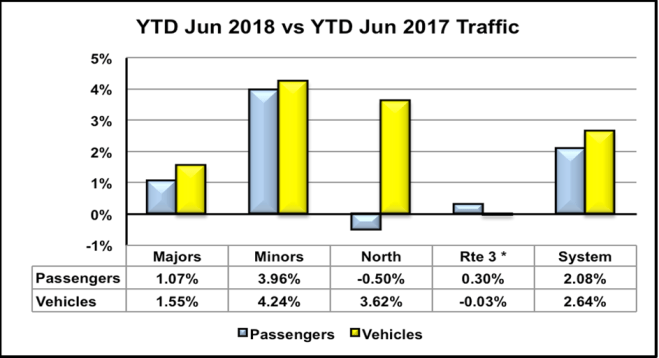
– passenger traffic stronger than vehicles on each of the Majors this month. A summer trend? Stay tuned.
– vehicle traffic up on both northern routes, while passenger traffic down on both routes. Increases perhaps related to LNG activity in Kitimat? If not this month, expect it to be a Rte 10 factor in coming months.
– Rte 9 up over 20%, but related to struggles keeping the Q/Nanaimo alive a year ago. Was not a fun month for BCF or customers
Graphs 3 and 4 show June traffic in sustained growth country for both the System and for the Minors. While the System and Minor route graphs look about the same, consider the actual numbers (why graphs alone aren’t always to be blindly trusted).
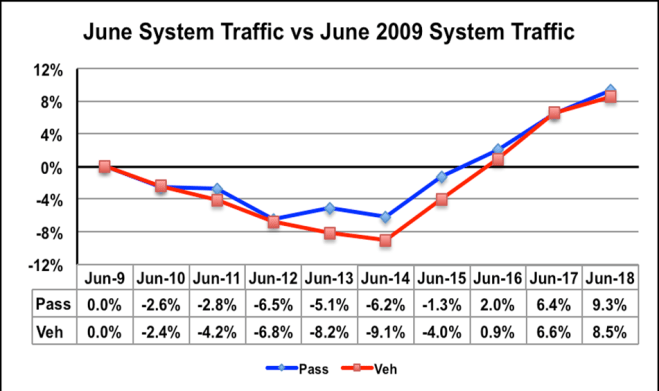

The System had lost 6.2% of its 2009 June passenger traffic and 9.1% of its June 2009 vehicle traffic by 2014, the darkest year. June passenger traffic is now restored to 9.3% over Jun 2009 levels, while vehicle traffic is up 8.5%.
June 2014 Minor route traffic had dropped by over 12%, compared to June 2009. A deeper ditch than the System. Yet June vehicle traffic is now up 8.6% over Jun 2009, while passenger traffic is up 5.9%.
Point being, the Minors took a much bigger hit than the System (read, the Majors), but have recovered, and are recovering at a faster rate than the big fellas. As to why, that’s another story, as yet unwrit. It’s likely the answers lie in a million details, specific to each of our routes.
The thirteen month graph (graph 5), reminds us that the system traffic is up, but not at the level we’ve come to expect over the past four years. The Majors are the drag this year, doing ok but not at the stellar level of past years. This is borne out by Graph 2, suggesting the Majors have been sluggish all this fiscal year. The April bottom bounce, of course, was the result of the loss of half the Easter weekend to the previous month.
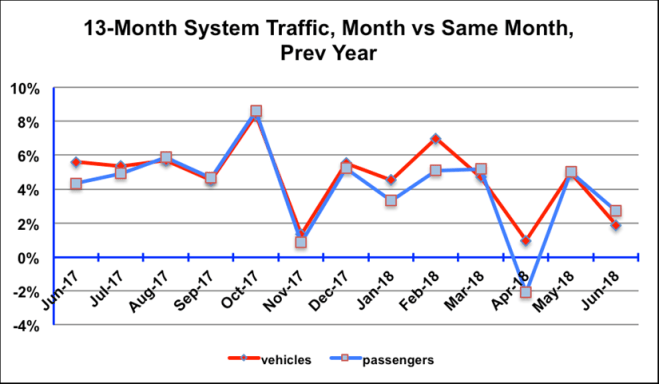
Graph 6, the daily traffic picture, shows clearly that the Minors have experienced increasing traffic, essentially every month of the same month in the previous year. While there are some ups and downs on specific routes, the overall message is crystal clear. The Minor routes are on a roll, and have been for the past four years. A roll which shows no signs of abating. The need for more capacity is emerging on more sailings, on more routes, every month. This summer is going to be more than painful on an increasing number of routes/sailings. As we’ve learned from experience, one and two sailing waits lead to visitors not coming back. Daily traffic graphs for Rte 3, the North and the Majors are not as clear as this one. Generally similar but mushier.

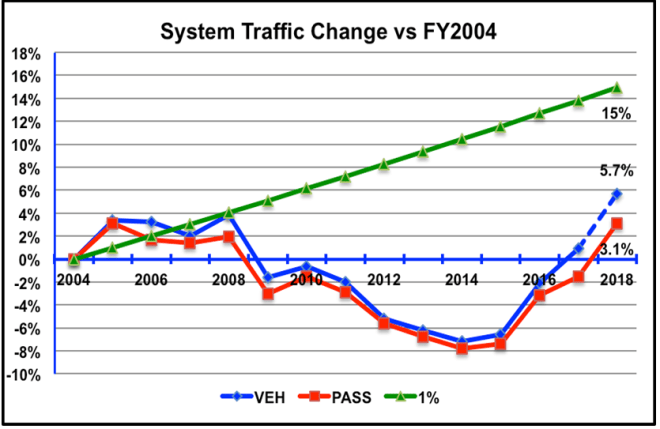
Graph 7, traffic has come a long way in four years. With the growth apparently softening with the Majors, the rate of increase could ease off a bit. Will depend to a large degree on what happens this summer.
Graph 8 has always seemed a bit weird, the split in direction in 1996 and 1997, passenger traffic increasing while vehicle traffic fell. Double checked, and that’s the way it happened. It was a time of rapidly (for then) rising fares, with locals storming the barricades, or at least the terminals. The gov’t of the day brought in a wise person who recommended the discounted ‘ticket’ fares be rolled back, while the cash fares remain at their higher levels. The move satisfied local residents, while it’s not so clear how visitors reacted to the fares of the day. It was evidently a time of ‘let’s do it and see what happens’.

So, what to expect . . .
While too early to see clearly what’s going on, it appears traffic growth on the Majors is settling down to a more modest pace.
Growth on the Minors remains strong and very likely will continue to do so through the summer.
Traffic on the Northern routes remains a crap shoot, dependent on weather, forest fires, as well as the usual, the Canadian buck, US politics, the price of gas. Sadly, it will not receive the hoped for boost from Rte 28, the new route (reincarnation of Rte 40, cut in 2014) to serve Bella Coola to Port Hardy. The service will not make it into operation this summer.
The 15% fare cut was expected to generate a traffic boost. It could partly explain the Minors traffic energy while the lack of a fare cut on the Majors could account for their relatively lack lustre performance.
It’s all a big wonderful world with enough moving parts to keep us all engaged for a lifetime.
With that ominous note, I leave it to you for questions, comments, inspirational and inspired contributions.
Brian
