
Written by Brian Hollingshead:
FACChairs,
A ‘Break-Out-The-Champagne’ month for traffic. November_2018_Traffic_Stats
All routes, with the exception of the enigmatic Rte 10, showing traffic gains, some of them substantial, vs Nov 2017. System wide, vehicle traffic was up 6.67%, passenger traffic, up 5.99%, over November last year (Graph 1).

A welcome improvement, particularly for the Majors, vs results through the year. As evident from Graph 2, the Majors have clung to what could most charitably be referred to as modest traffic increases since April. This, while the Minors have demonstrated consistent robust growth. The Northern/Central Coast routes‘ traffic numbers have been erratic, often with push/pull results between Rte 10 and Rte 11, presenting a misleading picture of any apparent trend.

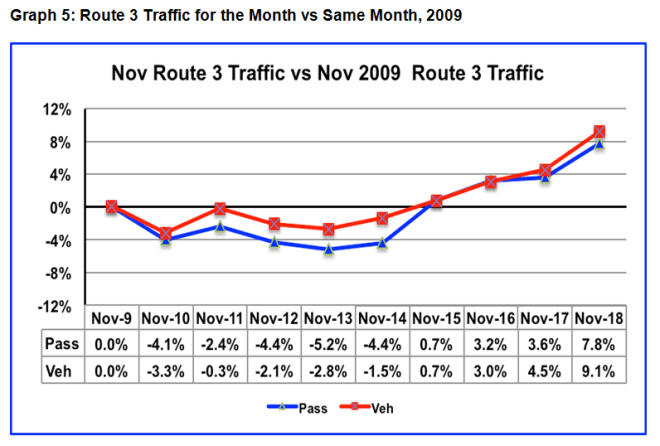
There have been times when apparently exceptional gains or losses have been caused more by results in the base month, than current month numbers. Graphs 3, 4 and 5 suggest this not to be the case this time.


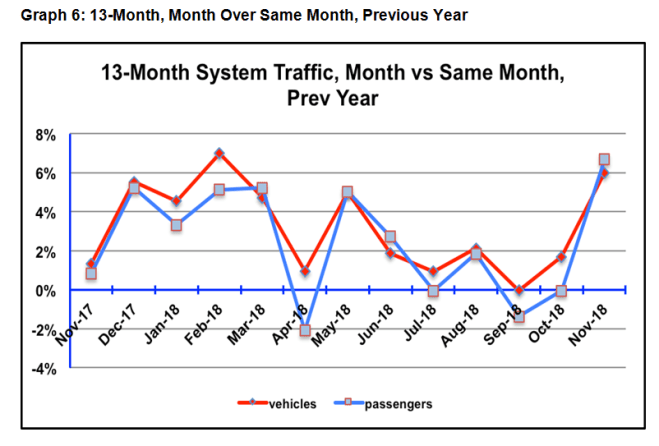
Graph 6 reinforces the point. November last year showed modest, if not dramatic, growth. So the current jump belongs to this November. All routes, Majors and Minors, were well above their year-to-date track records. Milder, though wetter, weather? Maybe. A random anomaly? Maybe, but not likely. The results were too consistent across the board for it to be a celestial coincidence. So we chalk it up as a mystery, at least to us, and move on.
Graphs 7 and 8, Daily Vehicle Traffic, a clever Gabriola John invention, are loaded with useful information. To wit, they show:

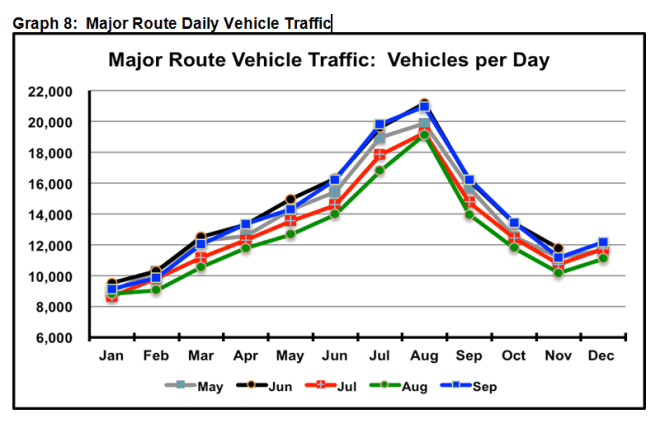
– the overall traffic growth trend for the past four calendar years
– the dramatic seasonality of traffic. While it’s cool that traffic shot the lights out this month, the fact that November sits 9th out of the 12 months for volume tells us that it won’t have provided a major revenue bonanza.
The main point, comparing Graphs 7 and 8, is
a) that the Minor routes have consistently shown clear traffic increases over last year, the single anomaly being for rain-soaked September, while
b) the Majors have shown similar growth up to, but not including, this year, when monthly growth evaporated.
We have attributed this shift to the fact of the Minors enjoying the 15% fare cut, that was denied to the Majors. Other factors, certainly (life is never that simple), but that seems like the outstanding one.
Graph 9, one of our favourites, would seem to show traffic is way less than what it might have been. And that is the case. However, it also shows that traffic has been storming back at a substantially greater rate than the 1% green-line theoretical growth rate, for the past four years. The size of the gap is the consequence of the long years spent in the Use Pay Wilderness.

Lesson to be Learned: Traffic can and will grow steadily in our environment of steady population and GDP growth, providing support funding doesn’t take a hard ideological turn to the right (again).
Graph 10 reminds us that BCF is now carrying more vehicles than at any time in the past, and almost more passengers than ever.

Projected year end results for graphs 9 and 10 are based on BCF forecasts (which we now believe to be a wee bit optimistic). Among the results of this growth rate are:
– more and longer sailing waits,
– potential customers avoiding ferry travel because of those waits,
– fractured on-time-performance as crews shoehorn in as many vehicles as possible for the increased volume of ‘peak’ sailings. Getting as many vehicles as possible on a given sailing has become the default Service Notice explanation for late sailings. Exact same wording each time. Sort of like Speed Dial.
BCF, to their credit has recognized this increasing demand trend and seems to accept it as a sustaining one, ordering bigger vessels, going to two for one replacements and building in a second ferry for Route 3. There also seems to be recognition of a need for greater redundancy (back-up capacity) to deal with incidents of ships falling out of service at precisely the worst possible times. For customers, the problem is the glacial procurement pace for new ferries. The need is now, but the delivery dates are years away. The arrival of the new ferries will, by themselves, result in traffic increases beyond those arising from the trends of the day.
So, next year?
Fares frozen at existing levels.
Traffic increasing, though not as quickly as BCF expected and hoped (but going in the right direction).
Climate change, apparently a reality in our part of the world, suggests another long, hot, possibly smoky summer, likely impacting ferry tourism, as this year.
The PT5 submission is now available for scrutiny and comment. No heart-stopping direction changes evident, presuming everybody plays nicely with each other for the next nine months. Worth FAC chairs doing a deep dive into it, confirming it’s as benign as it appears upon a quick read. And if not, needs a focussed response on behalf of our coastal communities.
Comments? If you wish . . .
Brian
