
Written by Brian Hollingshead
FAC Chairs,
Weather and autonomous vehicles shaped the ho-hum traffic results this December. Vehicle traffic up just 0.6% while passenger traffic down 0.6%. Unending rain topped off by brutal storms kept casual travelers at home. December_2018_Traffic_Stats
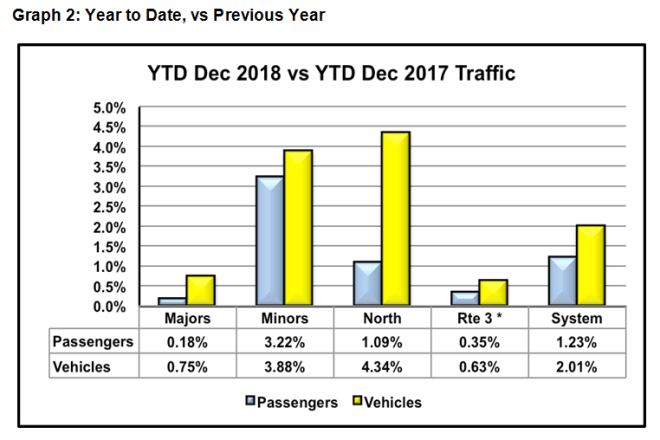
Check out Graph 1, particularly the Minors. Substantial vehicle traffic increase but with passenger traffic losses. The pattern is consistent through almost every Minor route as well as with Rte 30. Invasion of the self-driving SUV’s? Big drop in foot passengers? ‘You can go if you feel you must, dear, but I’m not going with you’? Typically, passenger traffic growth has lagged that of vehicles (Graph 2), but the magnitude of the gap this time is weird. Safe to say, in any event, that the crappy weather was an overriding influence.
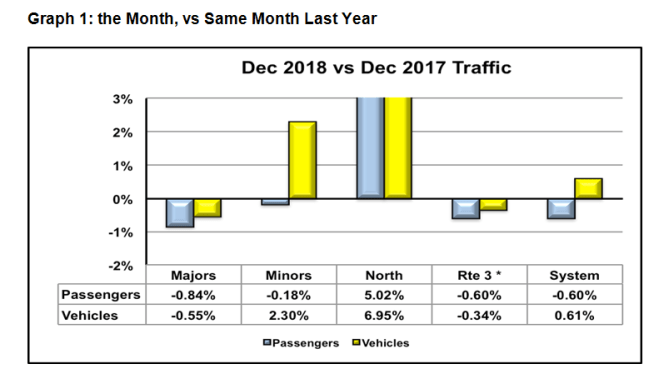
Consistent with observations through the year, the Minor routes outperformed the Majors, including Rte 3. The assumption remains that the 15% fare cut on the Minors, but not on the Big Three Majors, explains most of the difference. Rte 3, with the fare cut, but without the growth (this month and throughout the year), remains an anomaly.
While December is an iffy month – weather, holiday break, seasonal angst – the general trend (Graph 3) is a long climb, since 2012, out of the ditch. This December, like December 2016, was a pause in the process. Not likely a change in direction.

The historic December Minor route traffic pattern (Graph 4) is similar to the System trend, except for the Self-Driving SUV Effect this month. Note how typically, passenger traffic changes are in line with vehicle traffic changes. But not this month. Otherwise, the trend is consistent with Minor route performance through the year.

Rte 3 historic December traffic (Graph 5) shows a similar pattern to the Minors – tough one in 2016, and a pause this December. The difference, however, is that passenger traffic is aligned with vehicle traffic, as one would reasonably expect.

Graph 6 tells a number of stories . . .

– traffic this December just slightly different than last December
– as suggested last month, November was truly an anomaly vs the rest of this fiscal year
– April appears to be an anomaly, but only because it lost half an Easter weekend vs April 2017
– fiscal 2018 finished off a record year in March, dramatically improving upon the previous year’s traffic, and then,
– traffic in fiscal 2019 has struggled all year for a variety of reasons, the exceptions being May and November. The Majors have consistently performed below expectations, dragging down the System numbers
Nothing in this is news. Just presented from a different angle.
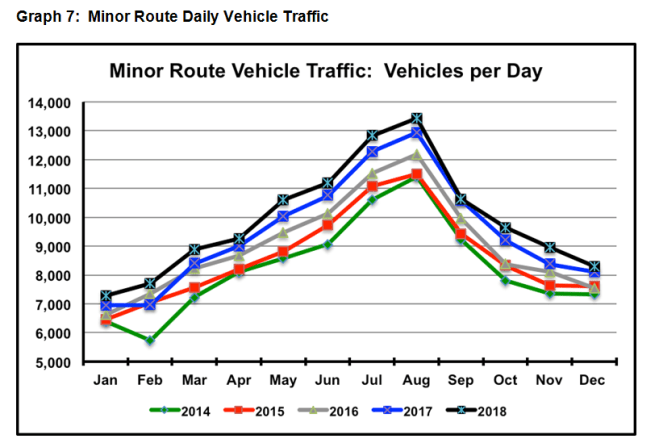
The Minor Route daily traffic picture (Graph 7) illustrates the traffic growth every month, year after year, since 2014. While there are summer peaks, the pattern is a year long one. As well is showing the year to year growth, it provides a month by month sense of the seasonal peaks and valleys.

Graph 9 shows the System traffic changes since 2004, the start of the current structure, vs a steady 1% increase. The overall picture is familiar. The projected 2019 numbers are based on BCF forecasts in the PT5 submission (2.6% vehicle increase and 1.6% passenger growth). The current YTD growth numbers are 2.01%, vehicles, and 1.23%, passengers, suggesting the final numbers shown are likely a bit optimistic. In the ballpark, but . . . With January and February being low volume months and March missing half an Easter weekend it enjoyed last year, there isn’t much can happen to improve the YTD results. To move the needle, as the politicians say.

The Long Look reminds us that traffic, notwithstanding this year’s lame performance, is still at record levels for vehicles and almost record levels for passengers. Again, the 2019 projected levels are based on the BCF forecast, and probably overstate what the actuals will be by the end of March.

The overarching message from this graph is to expect more overloads, especially on some routes, in the coming summer and shoulder seasons. This past year has been out of the norm, with the summer long smoke blanket and some goofy weather, discouraging traffic. It could be the ‘alleged’ climate change is actually real and may be expected to deliver ongoing weather surprises, chilling ferry traffic. That said, those lumps and bumps will be secondary to the fundamental drivers – population growth, tourism (political impacts), provincial GDP growth and reasonable fares.
It’s a crazy world out there these days, guys. We can be grateful for the relative tranquility/predictability of our ferry service. It ain’t perfect, but . . .
Questions, comments, rude suggestions . . . all welcome.
Brian
