
Compiled by Brian Hollingshead…
October, a good news, bad news month. October_2018_Traffic_Stats
The good news is the Minor routes traffic increase over last October. Graph 1. Vehicle traffic up a robust 4.61%, passengers, up 3.39%.
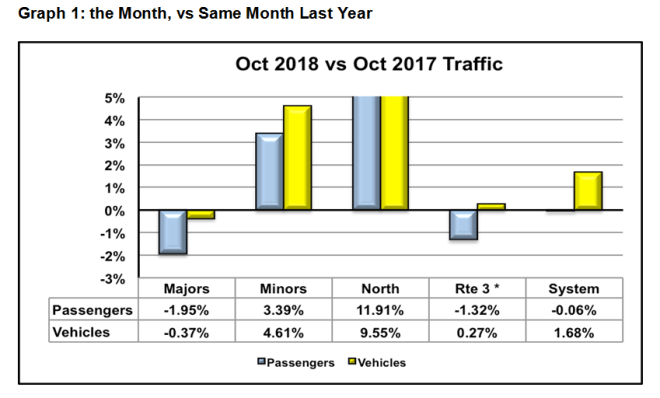
And then . . . there were the Majors, vehicles off 0.37%; passengers, off 1.95%. Throw in the northern routes up handsomely, but accounting for less than 1% of the traffic, not really adding anything to the corporate traffic picture.
End result: System vehicle traffic up 1.68%, passenger traffic down 0.06%. Sort of like getting kissed by that great aunt you don’t much care for.
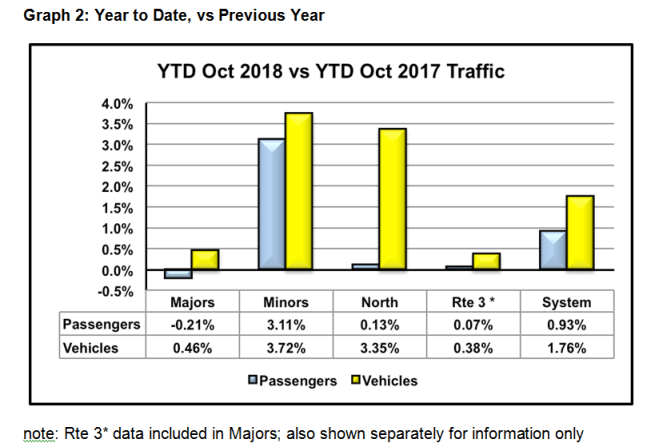
The year-to-date results (graph 2) mirror the Oct ones. The Majors are struggling while the Minors have been bringing home the bacon all year (and keeping the System results halfway respectable). Rte 3, which usually behaves, traffic wise, like a Minor route, this year seems to have suffered, and continues to suffer, the Major route malaise. As suggested previously, capacity constraints and less than stellar on time performance, have no doubt contributed to these results.
Graph 3, October System traffic performance shows the four years in the Wilderness, followed by a year of growth, a flat year, another growth year and then flat again this year. The squinty-eye picture is valid. October traffic, like the full year traffic, suffered for four years, and has been steadily improving since then. The comparison of individual Octobers can be significantly influenced by weather as well as other less dramatic factors.

The Minor routes version of the same graph presents a similar pattern, other than this October is a substantial improvement over October, 2017.

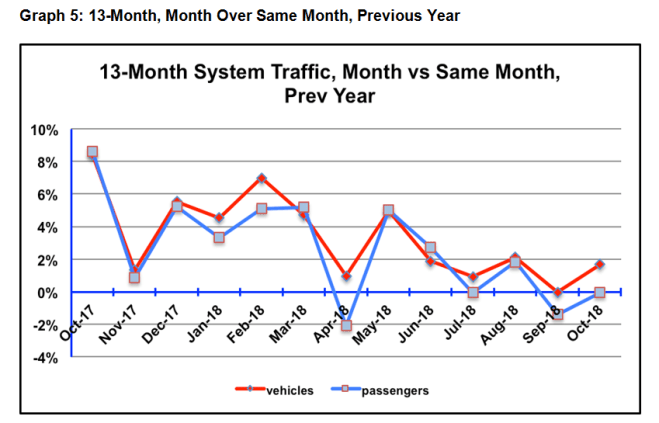
The Thirteen Month System traffic graph 5 partly explains the apparently lack-lustre performance this October. Last October, traffic was booming. To maintain that level or improve slightly upon it is still respectable. This indicates the risk of putting too much weight on year over year results. Any particular change may say more about what was happening a year ago than what’s happening now. The summer results reflect the same, somewhat misleading, situation. Last year, ferry traffic got a huge boost from the wildfires, as they effectively diverted a great deal of visitor traffic from the interior to the coast. This year, another set of wildfires messed up the whole province, covering us all with a blanket of choking smoke. Visitors responded by staying away, remaining in their hotels or abruptly shortening their stay.
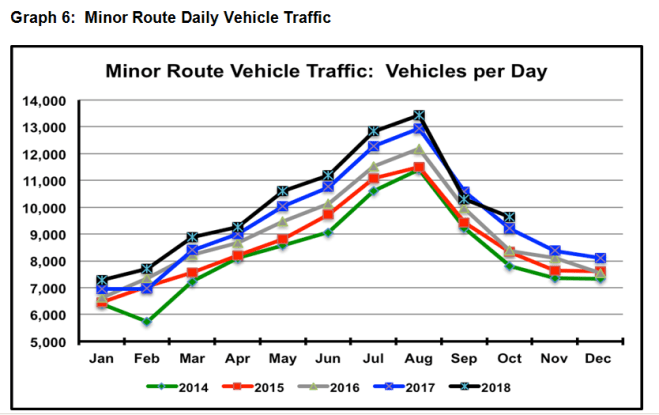
The Minor route daily traffic picture, graph 6, returns to its previous healthy trend. The dip last month was likely the result of uncharacteristic September monsoons. The traffic growth pattern for the Minors remains strong and consistent. Of course, not all Minor routes behave the same way. Last month, they were all over the map for gains and losses. This month, they’re pretty well all showing 3%+ growth, with the exception of rte 20, with a 7.3% vehicle traffic loss and a 1.6% passenger drop. But overall, it was a solid month for the Minors, with pretty well all routes pulling in the same direction
By the same token, the Northern routes group numbers are misleading. They’re often, as this month, up on one route, usually rte 11, and off on the other. Again, rte 10 enjoyed a spectacular season last year, with it being the primary route north, while Hwy 97 was shut down with the fires.
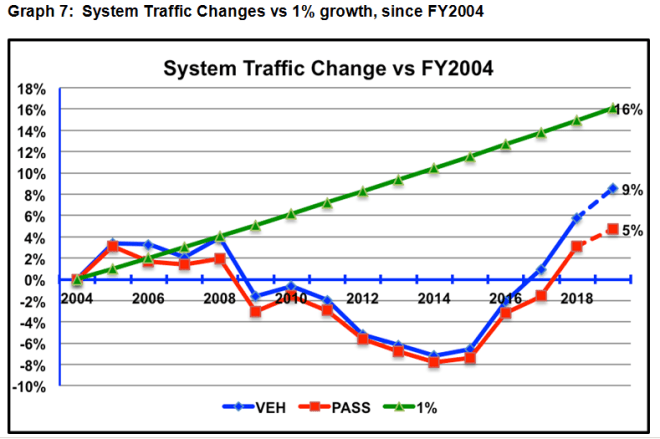
Graph 7 gets past the month-to-month looks and presents the full year-to-year changes since the present structure arrived on the scene. As seen with most of the monthly pics, there were some hard years that seemed to accidentally coincide with a litany of steep fare increases and gruesome fuel surcharges. The increases were substantial and then they grue some more. This graph now has the traffic results extrapolated to include FY2019, based upon BCF projections of 2.6% vehicle growth and 1.6% passenger growth. Not for us to say, but those projections may turn out to be a tad optimistic. As has been on a number of occasions, the bottom line is that, coming from where it was, traffic is darned good. So good in fact, that it’s stressing the system’s capacity to meet the demand, especially on some routes and in the busy season.
The Long Look, back to 1990, (graph 8) traces the consequences of the ideologically driven ‘user pay more, a lot more,’ approach of the government through the first decade of the present regime. It, too, now projects to FY2019, based on BCF traffic projections. The most recent dark years have been followed by four-going-on five years of more enlightened fare increases, with corresponding traffic growth. Some see this graph as a celestially ordained, or naturally occurring, cyclical process. It kind of looks like a lumpy sine wave. We might shyly suggest it’s more the result of governments, both orange and blue, overlaying their ‘fairness’ philosophies on the coastal ferry service. And then, after half a dozen or so years, experiencing an ‘oops’ moment and rethinking and revising those philosophies . And gosh, traffic then rebounds.

Balance of the year? Probably modest traffic increases, but less than might have appeared likely six months ago. The current BCF direction of broadly increasing capacity and relatively quickly, still makes a lot of sense.
The 15% fare cuts did what they were intended to do, increasing traffic and bring a ray of hope to the battered coastal communities. The fare freeze next year should assure that the robust traffic on the Minor routes sustains.
Comments, feel free.
Brian
