
Hi All,
Call it Smokie II, a just slightly healthier version of July traffic. August_2018_Traffic_Stats
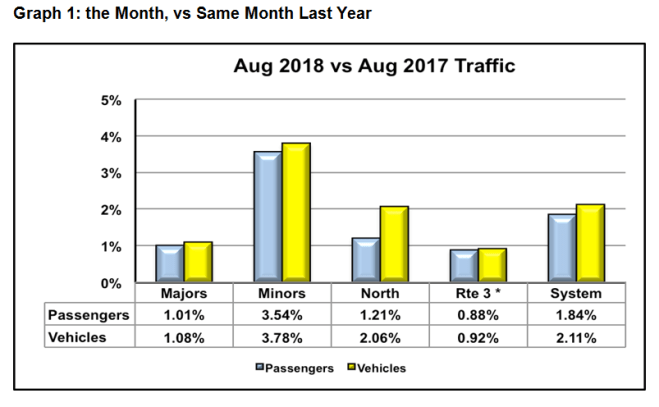
Overall traffic up about 2%, (graph 1) Majors, slightly less anaemic than last month, up 1%. The Minors up 3.8% for vehicles and 3.5% for passengers. Once again, the smoke dampened people’s interest in scenic travel, as well as tourism generally, resulting in August’s less than expected results.
While the smoke affected the summer traffic, it needs to be borne in mind that Major route travel has been flat all year, as suggested by the YTD graph 2. It does seem that the 15% fare cut on the Minors has fuelled their year-long traffic increase, while the lack of same on the Majors probably explains their doldrums. Not surprising. Rte 3 is the anomaly, having enjoyed the fare cuts, but not seeing any material traffic increase. Perhaps the lack of capacity (sailing waits) and lack of on time performance on the route contributed to the dampening effect.

Graph 3 reminds us that while System traffic was just modestly up over last August, it’s still higher than it’s been since 2009, and above a bonanza year last year, smoke and all. So, no tears, please.

Graph 4, shows August Minor route traffic on steroids, compared to previous Augusts. The fare cut has been a remarkable shot in the arm for traffic, and traffic is a surrogate for the economic and social well-being of our communities. The side effects of record traffic – overloads and sailing waits -are frustrating. That said, there is much-needed relief in sight for the hardest hit routes with the anticipated arrival of the first replacement ferries, followed by the five additional boats presently in the approval process. Anticipated delivery of the latter group is in the 2020/2021 time frame.

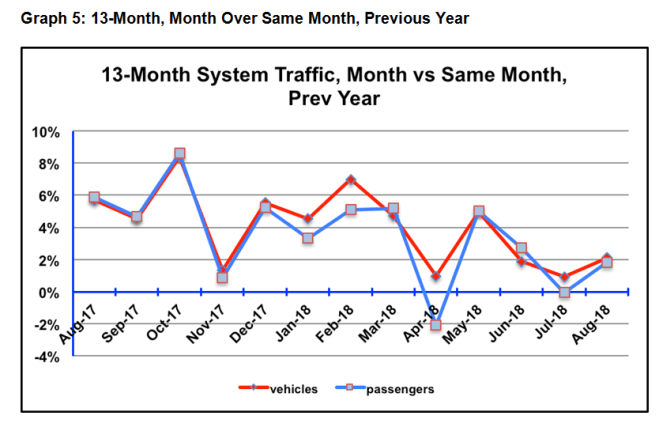
The 13-month track, graph 5, suggests this fiscal year’s performance since June as been positive but definitely less starry than that of last year. This is consistent with the YTD graph 2, but on a month to month basis.
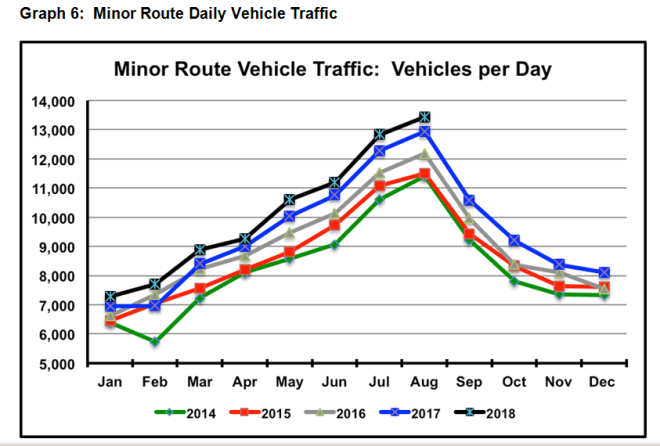
Vehicle traffic per day on any route or group of routes illustrates whether there are erratic results, or if there is a constancy. Graph 6 showcases the strong performance of the Minor route group, pretty much every month, every year since 2014. A comparable graph for the majors would show similar, though less robust, growth up to this year, and then the black line intertwined with the blue.
Let us not forget. We’ve said enough about graphs 7 and 8 in previous episodes. Suffice to say, traffic is hot, recovering from a too long spell in the wilderness. If and as capacity catches up to demand, we should be able to see the current trend continue, though perhaps at a less robust rate.


The future? In the absence of any catastrophic events between now and April, look for a vehicle traffic increase of 2%, year end, and 1.5% for passengers. March should be down from 2018, as it will lack the freebie half Easter weekend it enjoyed this past year. With August now in the bag, the remaining seven months aren’t likely to move the needle very much. Unless we get a zombie winter, and then all bets are off.
Last month we wondered about the relative percentages of reserved space vs deck room left for ‘standby’ customers. For the Labour day weekend, it boiled down to reserving between 80% and 90% of the passenger deck space on routes 1 and 30. However, given commercial traffic was down for the weekend, overall pre-committed space was generally under 70%. It meant giving the maximum number of people assurance they’d get where they wanted to go, when they wanted to get there. The result was a less rosy picture for the standby guys. Worked pretty well except when the Spirit of BC lost two round trips early Friday, and the day collapsed into chaos on the route, with a lot of disappointed folk who saw their reservation certainty evaporate.
As always, any questions, protests, denunciations or other rude comments, feel free.
Brian
