FACChairs,
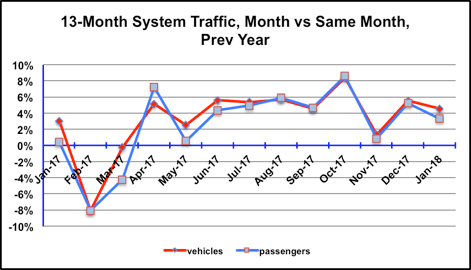
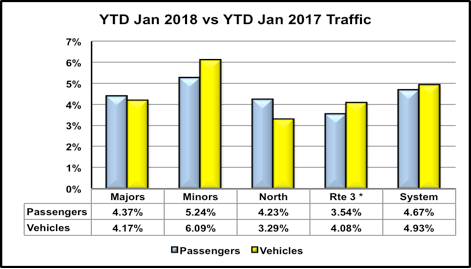
It seems we’re witnessing a new normal with the 4.5% vehicle traffic increase over Jan 2017, and 3.3% passenger step-up. These jumps are noteworthy in and of themselves, but are particularly so, given the weather we endured this past Jan. That sort of weather typically discourages anything but the most necessary ferry travel.As we found with most months this past year, traffic is generally up, in the 4% to 6% range. Always, the occasional contrarian route. But not many. Graph 1. The year-to-date stats, (graph 2) are solid and will remain so for the rest of the fiscal year (to Mar 31).

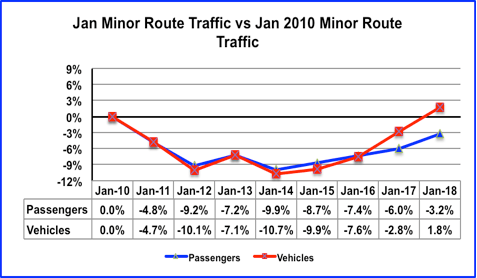
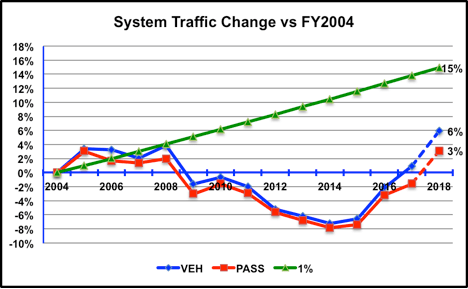
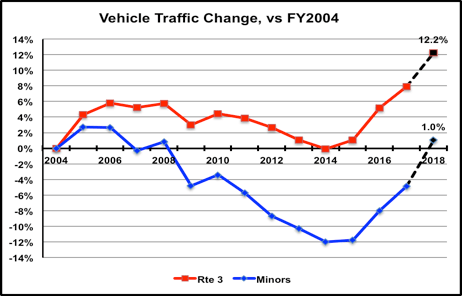
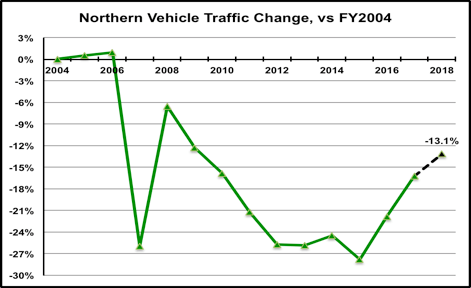
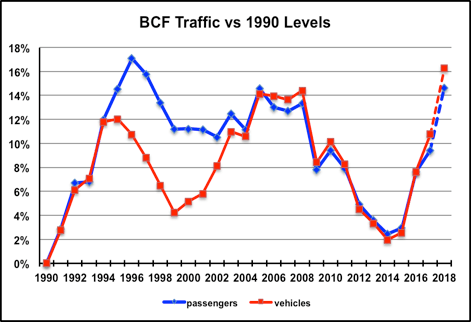
Graphs 3 and 4, show the longer look at Jan traffic for the system and for the Minors is consistent with what we’ve been watching all year, continuation of a three year strong upward trend. This Jan, passenger traffic growth didn’t keep up with vehicle increases. Maybe a concession to our rain-soaked weather?Graph 5 is a picture of the past year’s traffic. May and Jun bucked the trend, but overall, a solid year.Graph 6 presents three messages and a warning . . .1. We went through seven challenging years when steep fare increases and fuel surcharges were the order of the day. Traffic (and our communities) paid the price. While there were other factors, it’s our belief that fares were the principal traffic-depressing factor.2. Traffic has been on a roll for the past three years and it looks like the it’s going to keep rolling that way, barring any dramatic changes in the economy, the value of the dollar or cataclysmic world events. The 15% fare cuts and the return of the free seniors’ fares will stimulate a traffic boost, while the fare freeze on the majors will support continued growth.3 As strong as the traffic growth is, it’s still a long way below where we believe it would have been with even gradual growth resulting from modest fare increases (rate of inflation) since 2003.4. Ferry traffic is approaching uncharted waters, in terms of BCF’s capacity to accommodate the emerging demand on our routes. In the short term, we are going to see more routes, with more sailings, experiencing overloads where they never used to exist. BCF will have some limited means of increasing capacity through schedule tweaking. In other cases, that option is tapped out, and vessel capacity will need to be rethought, meaning larger than like-for-like replacements, two-for-one replacements, redeploying ferries to less demanding routes and accelerating some vessel retirements where the existing ones are no longer up to the job. These are longer term strategies – maybe three to four years – and will be dependent on available funding. The alternative is watching the service of which we’re so proud gradually come undone. This is not a new discussion. Nor is it going away any time soon.Graphs 7 and 8 are reminders that all three of our route groups are seeing the same growth projections. Rte 3 is one of ‘our’ route groups, as it experienced the same fare increases and service debilitating decisions that the rest of us did.Graph 9? Back to the uncharted waters comment.Brian