The Fare Cap
MAY 21, 2015 – The Ferry Advisory Committee chairs were pleased, and surprised, with the announcement of the 1.9% preliminary fare cap. Surprised, because with a nominal 2% inflationary increase in expenses, and the substantial capital program, we were expecting a much higher cap. Given the ground rules – existing service levels and assumed continuance of FY2016 service fee – we realize getting to a 1.9% fare cap was a major achievement. Any further reduction that might be considered between April and June would require additional accommodation.
Sustainability
Sustainability, the term, is borrowed from environmental science referring to ‘endurance of systems and processes’. We hear it referred to in terms of sustainability of the coastal ferry service, as if BC Ferries is in danger of no longer ‘enduring’. This seems to us like wondering if UBC or BC Transit or VGH or the Coquihalla Highway will ‘endure’. In fact, we believe that all four of those, as well as BC Ferries, will (and must) endure, hopefully in good health. That good health will depend primarily on adequate funding from governments and ‘customers’. All five are vital elements of the broad community infrastructure. The demise of any is inconceivable.
We are more concerned with the economic sustainability of the ferry-dependent communities served by the Minor and Northern routes, and Route 3. The ferry service is the economic life-line for these communities.
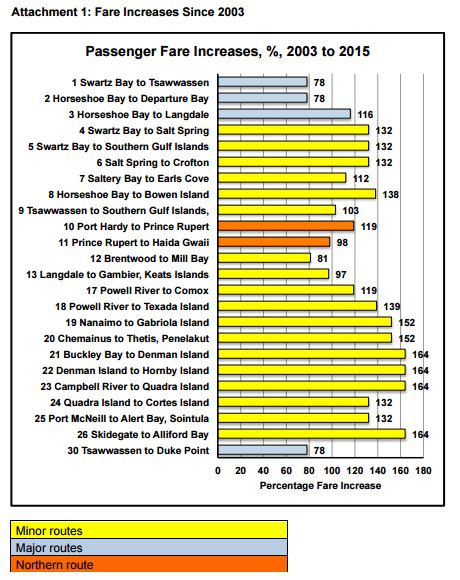
Over the past decade, we have seen the micro-economies of our once-vibrant communities slowly but steadily wither. Death by a thousand cuts. We, and local business operators, believe the rapid rise of ferry fares to unprecedented and unaffordable levels (Attachment 1) is the primary cause of the decline of most of our local economies. While the communities will likely remain on the maps, their economic sustainability is in grave danger.
Economic sustainability of coastal communities absolutely must be assessed and included in any future plans for coastal ferry service. Adequate funding and service levels must be factored into any vision that values adequate, affordable life-line transportation to and from coastal communities.
Local Economies
Macro-economies expand or contract in response to major events, largely beyond local control. Consider:
- Alberta’s economy responding to the slump in oil prices.
- California’s economy responding to cataclysmic water shortages.
- Ontario’s economy responding to changes in the value of the Canadian dollar and low-cost foreign production.
The effects of these negative events include widespread bankruptcies, massive lay-offs, plant closures, destruction of once-productive farms and orchards.
Our local economies, on the other hand, experience hard times in local terms. With few exceptions, the economies of our communities are all about small, family-operated businesses. Those include country inns, local pubs, eco-based businesses, restaurants, B&Bs, residential construction and trades people, artists, realtors, small farms, general stores. Most are heavily dependent on tourist traffic and, to a lesser degree, on the in-migration of urban dwellers to supplement the diminishing ranks of full time residents. Powell River and the Southern Sunshine Coast are notable exceptions with heavier industry and larger retail and service sectors. Yet their problems remain the same.
Rather than factory closures, shrinking economies in our communities manifest themselves as B&B’s closing, pubs and restaurants shutting for the winter season and operating on short weeks through the shoulder seasons, businesses laying off staff, young people leaving the communities for lack of work, artists leaving, seeking healthier markets. It’s a circular process, with fewer and fewer visitors attracted to the communities as local attractions become less available. While not exactly a death spiral, the process saps a community of its heart and soul. Or less dramatically, the people who provide the many volunteer services – fire fighters, ambulance attendants, entertainers, summer markets, local theatre – that make a community come alive.
Traffic changes
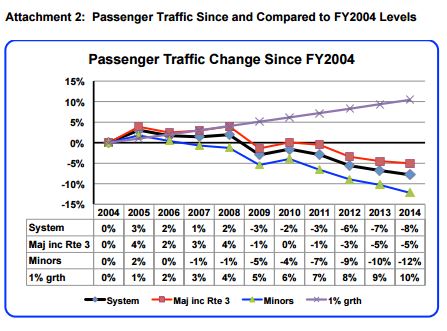
Ferry traffic in FY2014 was the lowest it’s been in over 20 years, having dropped precipitously since 2008. Attachment 2 illustrates traffic changes on the Major and Minor routes since the current organization was established in 2003. It is evident that traffic losses began sooner, and dropped more, on the Minor routes than on the Majors, no doubt related to the Minor route fare increases and fuel surcharges being approximately double those of the Majors. Changes in population and GDP are commonly recognized ferry traffic determinants. Given the increases in both, it is posited that a traffic increase of 1% per year would have been a conservative expectation, had fare increases been kept in line with CPI increases.
Traffic is the lifeblood of our ferry-dependent communities. We, and most others, believe traffic is directly related to both the rate of increase of fares, and their absolute levels. Thus, any discussion of future fares, as they relate to the 3 economic health of our communities, must start with an understanding of traffic, where it’s been and where it’s going. Attachment 2 provides the starting point, major and minor route traffic changes since 2003. Major route traffic grew at about 1% for the first four years until the 2008 meltdown, when it commenced its downhill drift. Minor route traffic grew slightly the first year, and has been declining steadily ever since. Though not shown on the graph, northern route traffic has dropped a shocking 25% for vehicles and 31% for passengers since FY2003.
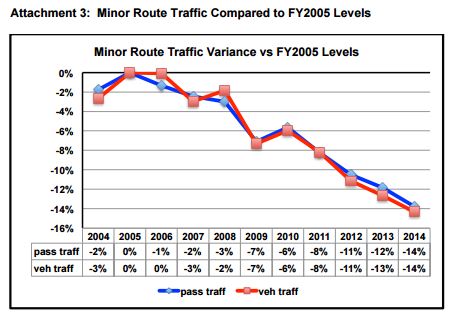
Zeroing in on Minor route traffic since its peak in FY2005 (Attachment 3), it’s clear the trend has been steadily down as fares went steadily up. The drop was more abrupt in FY2009, thanks to global economic difficulties, together with the imposition of an 18% fuel surcharge Aug 1, 2008, which brought traffic to a screeching halt in what is usually the highest traffic month of the year. Minor route traffic recovered somewhat the following year, returning to its previously established downward path. Given the constancy of the trend line, there is little reason to expect it to change dramatically in the absence of a significant resetting of fares.
Discretionary vs non-discretionary traffic
There is a spectrum of necessity to ferry travel, from the commuter going to work five days a week, to the visitor checking out the weekend market. While there are black and white examples, there are fifty-one shades of grey in between . . . the person who must go ’to town’ but can maybe get by going once every two weeks rather than every week, the person visiting his dying relative in the hospital, the person connecting with an airline for a European vacation, and so on. Each community has its own discretionary traffic profile.
The discretionary, and leaning-to-discretionary, traveler is going to be most sensitive to high fares. The commuter has no choice in the short term. In the long term, he will consider moving to where the work is.
There is a theory that suggests there is a lower limit to how far the discretionary traffic can drop before it ‘bottoms out’. This limit, if it exists, is critical for tourism businesses, in making decisions based on whether or not such a limit is at hand, or whether business is going to continue to decline. The split of Minor route traffic between Experience Card traffic (E-Traffic) and cash ticket traffic is a reasonable surrogate for discretionary and non-discretionary traffic. Generally, people living in the communities have Experience Cards (E-Cards). Visitors usually don’t. There are some weaknesses in the assumption – Route 9 doesn’t have E-Card fares; some residents will be traveling on E-Cards for discretionary purposes – but it’s the closest we have to a workable tool to make the comparison. A related problem: the buy-in cost can be too high for some living below the poverty line, resulting in their having to pay full cash fares, a 4 compounding hardship. BC Ferries has built in some flexibility to cover such situations, but it doesn’t resolve them all.
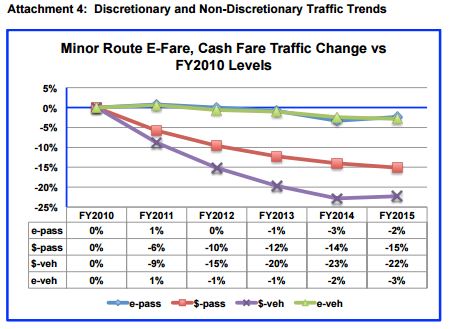
There are some who have watched the average fare decrease as the percentage of minor route E-Card travel increased. The explanation we’ve been offered is that local residents who’d been paying cash were migrating to E-Cards as fares increased, causing increases in E-Card travel. In fact, as Attachment 4 illustrates, E-Traffic has been slowly declining, while the cash fare traffic has been dramatically dropping. The former reflects non-discretionary traffic; the latter, discretionary traffic.
The point of this is that while traffic declines may be seen to be slowing down, the discretionary traffic, the bread and butter of our tourism economies, has been falling much more rapidly (15% for passenger and 22% for vehicles in just five years). While traffic may or may not be bottoming out, it needs to recover if there is to be any hope of breathing life back into coastal ferry communities tourism.
Relationship of traffic to fares
There have been several elasticity studies to try to predict traffic outcomes related to fare adjustments. Their conclusions point in similar directions. One thing they, and most everyone, agree on is that fares do affect traffic. How much is open to discussion. Our point is that there needs to be an elasticity factor established for just the discretionary traffic. The relatively high proportion of non-discretionary traffic, which has very little elasticity, is masking the discretionary traffic elasticity.
And it’s been that dramatic shrinkage of discretionary traffic, that we believe is substantially responsive to fare levels, that’s crippling our local economies.
Balance: government funding, service levels, BCF efficiency, fares
We realize there needs to be a balance between government funding, service levels, internal BCF efficiencies and customer fares.
We accept that the Province has to retain the right to determine its contribution, and in so doing retains the final say on how high fares and fare increases will be.
Service levels have been dramatically cut on the Minor and Northern routes, and somewhat less dramatically on Route 3. Meanwhile, service has been just modestly tweaked on the Big 3 Major routes. Part of the Province-directed initiative to save $18.9M specifically through service cuts, was a $4.9M commitment to be realized on the Big 3 Major routes this year. We now 5 understand BCF has decided to abandon that commitment. The company indicates it hopes to realize the savings through other unspecified, non-service related efficiencies. This contrasts to the rigid environment in which the cuts on the Minor and Northern routes, and Route 3, were imposed.
We believe there should be no further cuts on the Minor and Northern Routes and Route 3, without a full community impact study on the cuts already made and any cuts proposed for future consideration. The absence of such an indepth study prior to the last round of imposed cuts was out of keeping with Commission recommendations regarding consultation prior to undertaking major changes.
We accept from the BCF reviews conducted as part of the PT4 process that BCF is effectively managed, and continues to find efficiencies as and where it can. Hopefully, the pursuit of further cost-effective efficiencies will be a way of life in the corporation.
Finally, to fares. There are no absolutes. A few people still buy Ferraris. But there does seem to be general consensus emerging in government and BCF that fares are too high. There is wide-spread certainty along the coast that fares have long since passed the tipping-point threshold and have caused, and continue to cause, substantial economic hardship in our ferry-dependent communities. While it may seem great that the passengers are now paying, between fares and Sunshine Breakfasts, over 100% of operating costs, the price of getting there has been too dear.
Recommendation:
In the interests of beginning to restore economic stability to the ferry dependent coastal communities, we recommend that fares on the Minor and Northern routes and Route 3 be reset by a 20% to 25% rollback April 1, 2016, achieved through some combination of additional government funding, further BCF efficiencies and service reductions on the Big 3 Major routes. We would then expect to see subsequent fare increases in the order of CPI increases in the following years. Such an adjustment would fall, we believe, within the ambit of balancing the interests of the users and the ferry dependent communities with those of BC Ferries and the Province.
The Province can decide to reverse the economic decline of the coastal community. Please, let’s not lose this once-every-four-years opportunity.